
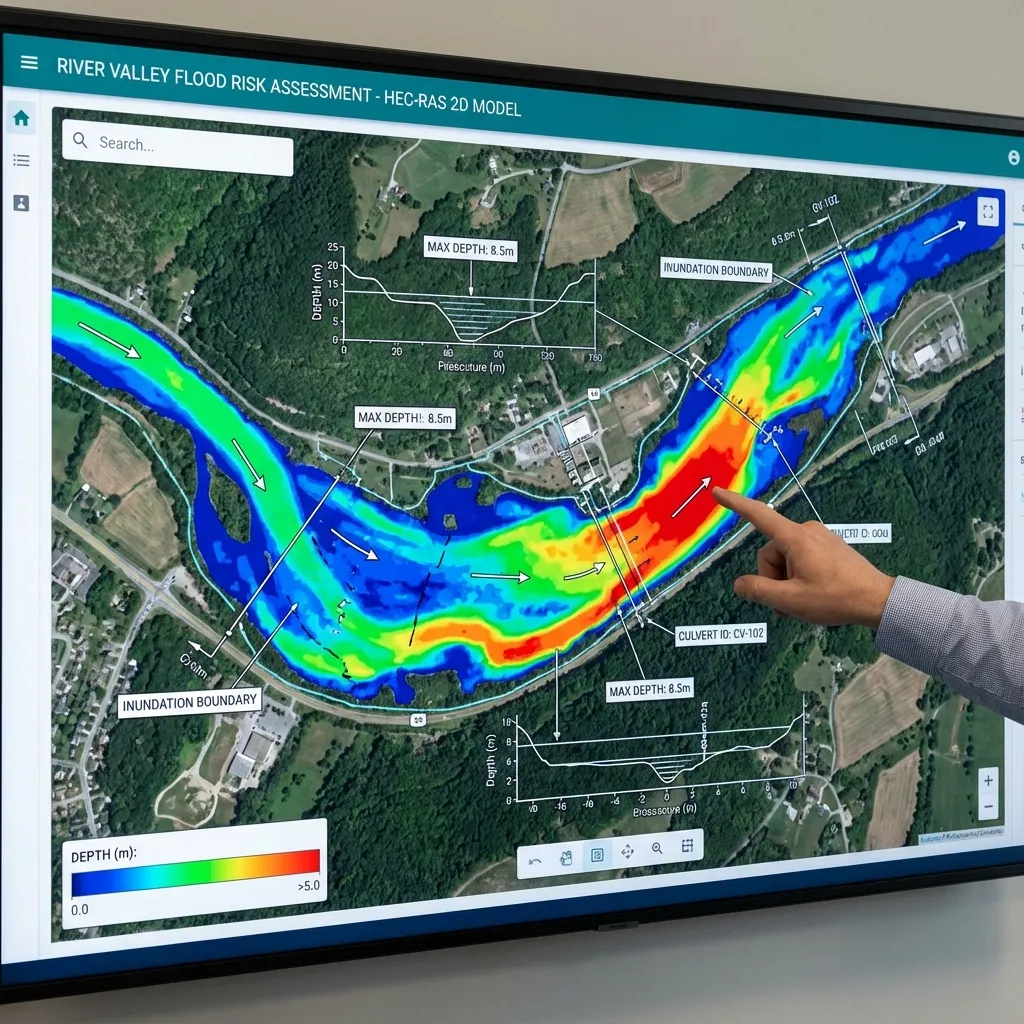
A flood risk analysis is the structured study of how a parcel or a building may be affected by flooding. It assesses flood hazard (how high the water will rise, how fast it will flow and where it will spread) together with ground and building elevations. Instead of producing one number, it shows which result is expected under which scenario and which assumptions that result rests on. This article describes a general workflow; the scope of any project follows the competent authority's written request and the project conditions.
1. Clarify the purpose and scope
The first step is the question the analysis must answer: the condition of an existing building, the choice of elevations for a planned one, or the technical information requested for a permit application? The return periods to compute, the study boundary and the required outputs (maps, tables, report) are fixed in writing at this stage. If an authority has issued a request letter, the scope is read first against that letter.
2. Collect the data
A reliable analysis rests on reliable data. It needs current topography or a survey, stream cross-sections, bridge and culvert geometry, land use and, where available, observed rainfall and flow records. The source, date and resolution of each dataset are recorded; missing data are handled by surveying or narrowing the scope, not by closing the gap with a single assumption. For the detailed list see data and project files required for flood analysis.
3. Hydrology: determine the flood discharges
The hydrological study computes the discharge arriving from the catchment for the selected return periods. Without an observed flow series, rainfall-runoff methods are used; which method fits depends on catchment size, data and purpose. You can quickly check Rational Method or SCS-CN results with our calculators; for details see the hydrological study report.
4. Build the hydraulic model
The discharges enter a hydraulic model containing the geometry of the channel and floodplain. A one-dimensional (1D) model can be appropriate in narrow valleys where flow is mainly in one direction, and a two-dimensional (2D) model where water spreads over the floodplain; the differences are covered in comparing HEC-RAS 1D and 2D. Boundary conditions and roughness (Manning's n) are among the inputs that influence the result most; see boundary conditions and roughness sensitivity.
5. Compare hazard maps with parcel elevations
The model produces water depth, velocity and extent. The real contribution of a risk analysis is reading these outputs together with the parcel boundary, ground level and building elevations. Different parts of one parcel can see different depths, so the condition of the building and its entry points is examined rather than a single point. For reading principles see reading flood hazard maps and parcel flood risk.
6. Show the uncertainty, report and state the limits
Input and model assumptions affect the result. Sensitivity tests with reasonable alternatives for roughness, boundary condition or discharge make visible how much the result depends on each assumption. Where observed water levels exist, comparing the model with them increases confidence. Details: uncertainty and scenario analysis in flood models.
The report presents purpose, data, methods, assumptions, scenarios and results in a traceable way. A risk analysis does not replace an authority's opinion or approval; an authority's opinion is that authority's own assessment. The report should also say which questions it does not answer.
The report should also contain: a map of the study area and the parcel boundary; the source and date of the topography used; the selected return periods and the source of the discharges; the assumptions of the model set-up (roughness, boundary conditions, structure geometry); depth, velocity and extent maps for each scenario; and a table comparing the parcel and building elevations with the results. This information allows another engineer to reproduce the work.
Common mistakes include presenting a single scenario as a definite result, using old or low-resolution topography without checking it, leaving structures such as bridges and culverts out of the model, never considering the possibility of blockage, and never comparing the model with an observed water level. Whether a parcel is "in the flood zone" often needs more than a yes-or-no answer: the depth, velocity and duration of the water have to be read together with the elevations of the building's entrances and ground floor.
Finally, an analysis shows the ground and building conditions at one point in time. Later interventions such as fill on the land, a new road or a change in the channel can alter the result. The report should therefore state which date's conditions it rests on and note that the analysis may need updating when conditions change.
Even for a small parcel the analysis must be done at a level appropriate to the scope and data quality. A very small area may not need a detailed two-dimensional model, but a decision should not rest on a simple distance criterion before it is understood how water is directed by the stream, neighbouring buildings and roads. Which level of detail is sufficient is decided for each project and by the authority's request, and the reasoning for that choice belongs in the report.
Sources and related articles
Let's define the scope of a flood risk analysis for your parcel or building together.
Request a project quote