1953–2021 · 12 events

Historic Floods

Explore flood records from Türkiye, Azerbaijan and around the world to understand how water and settlements interact. Follow the events from oldest to newest; each card provides verified sources and a separate engineering interpretation.

A photograph’s location and capture date are separate from the event date. Regional photographs are not presented as images of the disaster. Engineering interpretations are explanatory assessments by ArchSu, rather than definitive causes or ready-made design dimensions.

Flood timeline

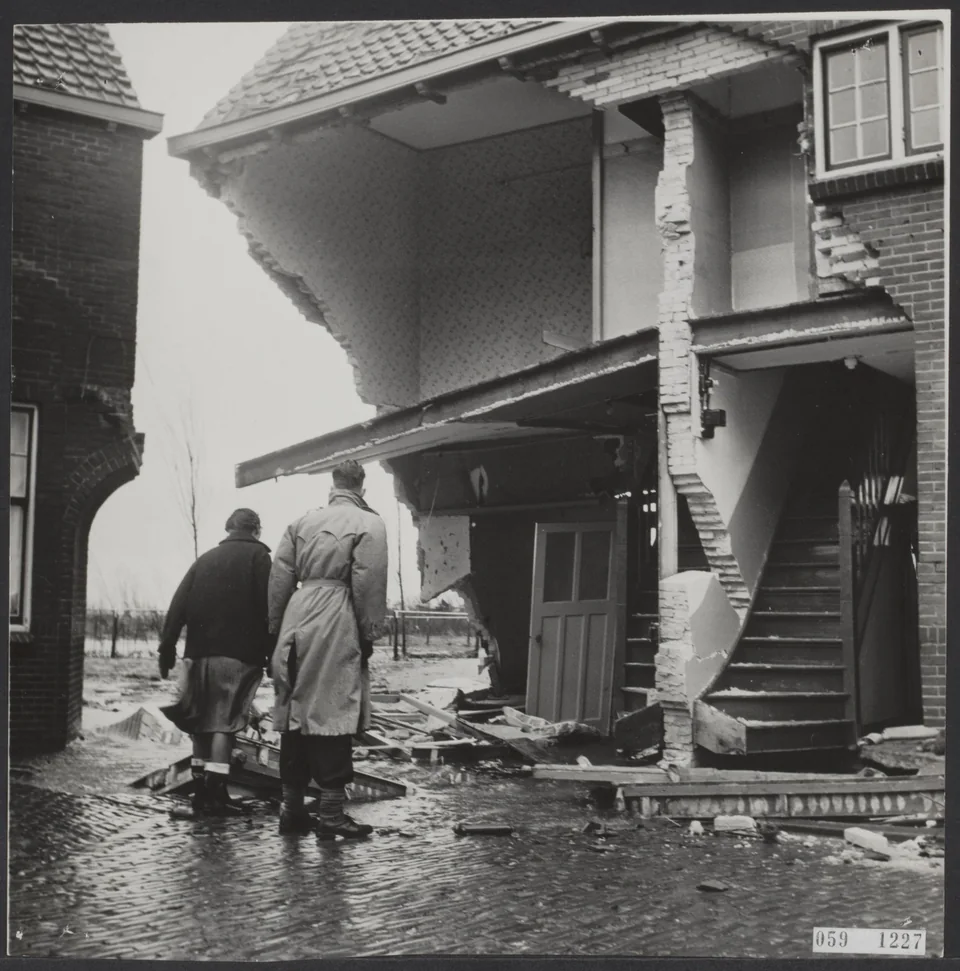
Maassluis, Netherlands — a building damaged during the flood of 1 February 1953.
Maassluis, Netherlands — a building damaged during the flood of 1 February 1953. Photo / source: Daan Noske / Anefo / Nationaal Archief · CC0 Resized and converted to WebP.

Netherlands / North Sea

North Sea: Water beyond coastal defences

The North Sea flood on the night of 31 January and morning of 1 February 1953 became a turning point for the Dutch coast. Seawater reached settlements and agricultural land. Rijkswaterstaat records the combined effect of a northwesterly storm and high spring tide, with coastal dikes overwhelmed or damaged at many locations. KNMI describes the weather system and the difficulty of getting warnings to residents at the time. After the disaster, the Netherlands reconsidered coastal protection through the Delta Works, a programme of engineering interventions delivered over many years.

This coastal example has a different starting condition from a rainfall-driven river flood. Sea level at the boundary and the timing of storm and tide have to be read together. When using historical evidence today, the former dike geometry, ground elevations and settlement pattern must be distinguished from present conditions. One structure photograph or water-level observation cannot describe the entire coast. The event therefore offers context for examining protection systems and warning chains together, rather than a ready-made design value for another site.

Engineering interpretation

Coastal assessment should consider sea level, waves, defence continuity and evacuation routes together. The presence of a defence does not remove every flood scenario in the area behind it.
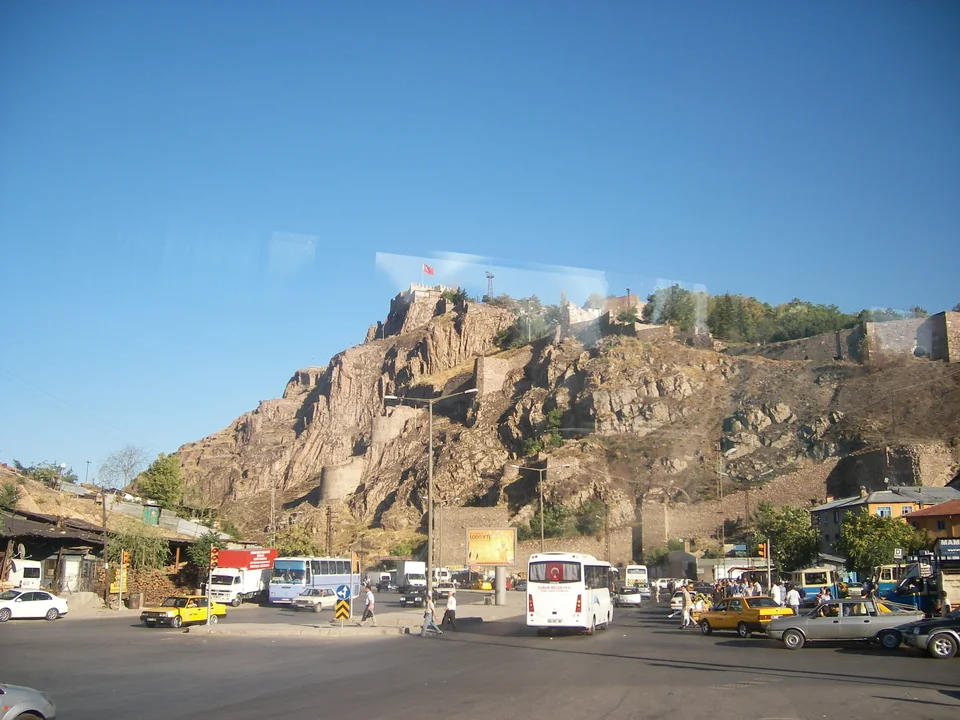
Bentderesi, Ankara — a regional photograph from 2007; it does not show the 1957 flood.
Bentderesi, Ankara — a regional photograph from 2007; it does not show the 1957 flood. Photo / source: Vikiçizer · CC BY-SA 4.0 Resized and converted to WebP; same licence.

Ankara, Türkiye

Ankara: Flooding along the Hatip stream valley

The flood that reached central Ankara on 11 September 1957 is an important historical example of the relationship between the city and the Hatip stream valley. Parliamentary records from the period document assistance and housing work for affected residents. ASKİ also identifies the flow from the Hatip catchment among the major floods in the city’s history. The event is therefore useful for considering the route of water through an urban area alongside the need for accommodation after a disaster. No single loss figure is assembled here from differing historical accounts.

Present-day Ankara does not have the same land use or infrastructure as the city of 1957. Placing historical valley names on a modern map can help an investigation, but an old flood boundary should not automatically become today’s risk boundary. Archive records provide a starting point for finding former flow paths; current elevations, open and covered stream sections, and subsequent development need separate examination. This example supports preserving a city’s water history and reading historical evidence together with measured information from the site.

Engineering interpretation

A parcel assessment should investigate historical valleys and surface-flow connections as well as today’s stream alignment. Building elevations require current terrain, hydraulic boundary conditions and flow-path information together.

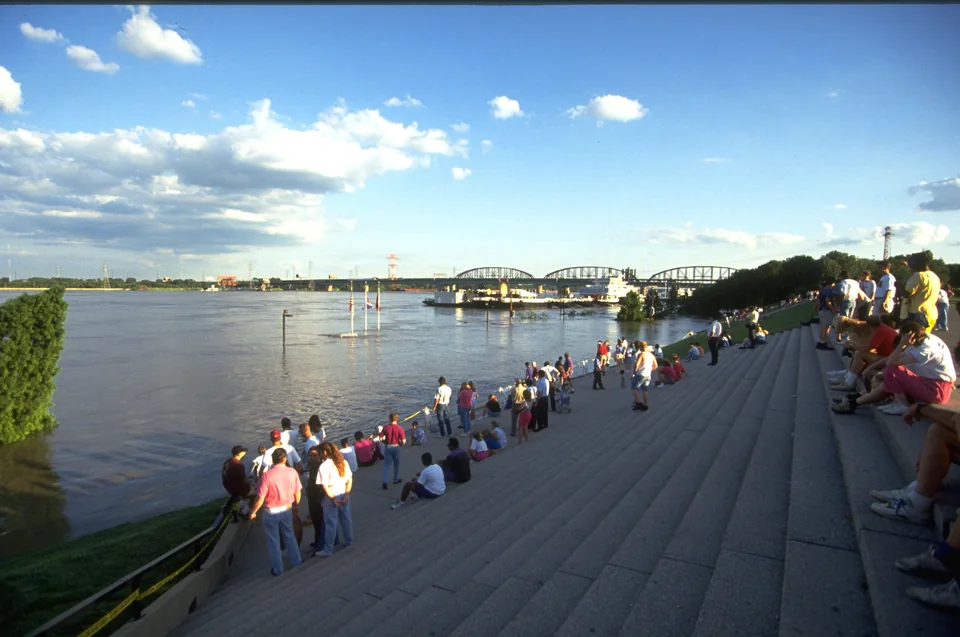
1993 Midwest floods, United States — high water viewed from the riverbank on 9 July 1993.
1993 Midwest floods, United States — high water viewed from the riverbank on 9 July 1993. Photo / source: Andrea Booher / FEMA · US federal public domain Resized and converted to WebP.

Mississippi–Missouri, USA

Mississippi–Missouri: Months of high water

The Great Flood of 1993 was a widespread sequence of events from May through September along the Mississippi and Missouri rivers and their tributaries. USGS records peak levels and discharges at individual stations, showing that the basin was not affected everywhere on one date. Farmland, settlements and transport routes were exposed to high water, and some levees were damaged. The long record and numerous measurement locations make this an important record for examining how flow evolves through a large catchment. The flood lasted much longer than the brief moment captured in any single image.

In a river system of this size, local rainfall and the discharge arriving at a location need not follow the same timetable. A rising tributary, water levels on the main river and storage on the floodplain are considered together. Comparisons between historical stations should preserve the measurement location, elevation reference and period of record. A record at one station does not give every tributary the same recurrence interval. The 1993 example therefore encourages reading the hydrograph and event duration, rather than choosing only the largest discharge.

Engineering interpretation

In large catchments, hydrograph volume and duration matter alongside peak discharge. Downstream levels, tributary timing and floodplain storage should match the model boundaries; recurrence intervals at different gauges must not be assumed identical.

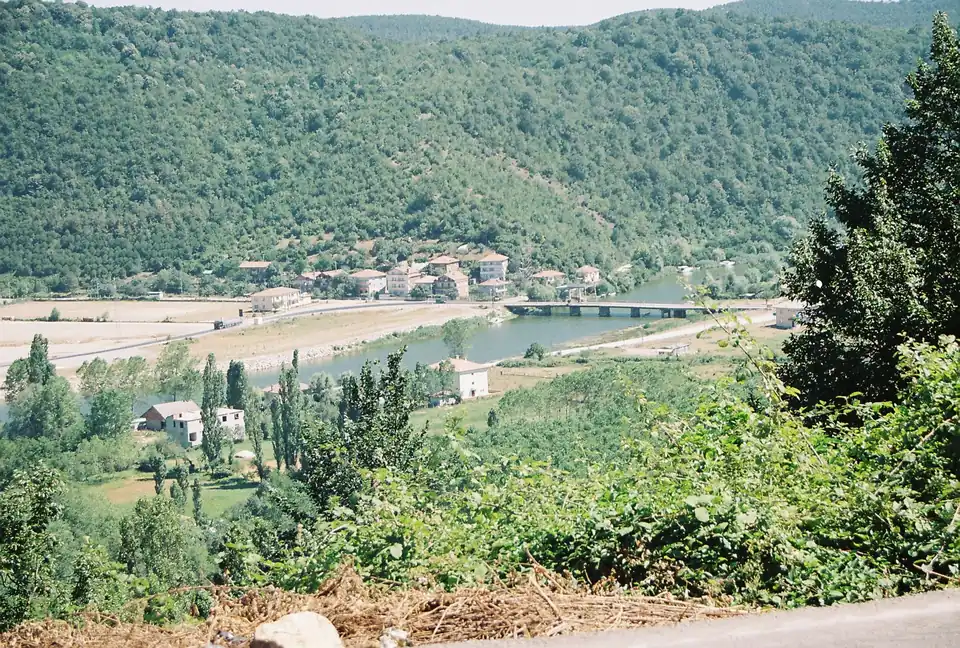
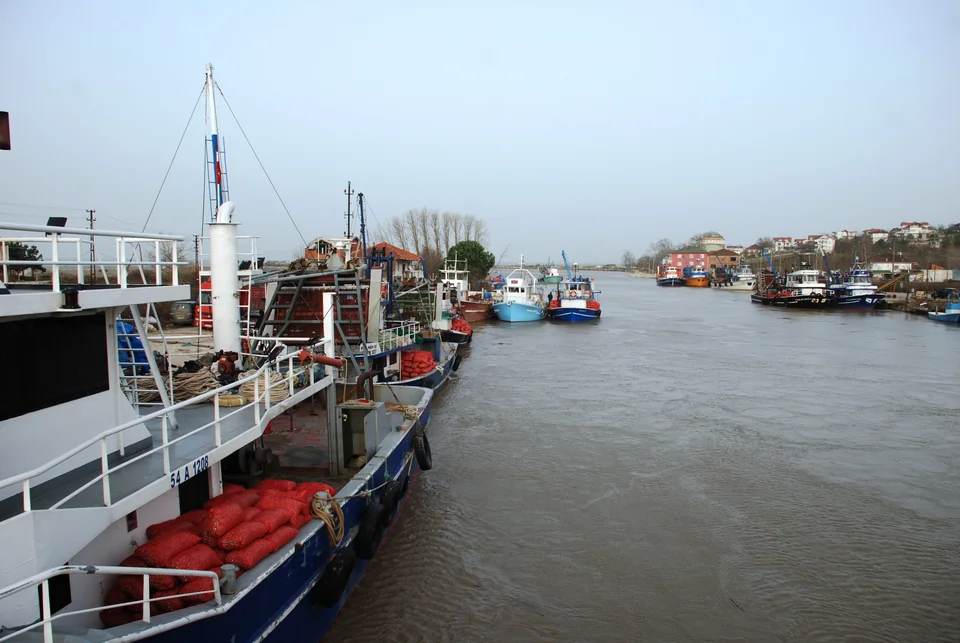
Bartın River — a regional photograph from 2007; it does not show the 1998 flood.
Bartın River — a regional photograph from 2007; it does not show the 1998 flood. Photo / source: Makalp · CC BY-SA 3.0 Resized and converted to WebP; same licence.

Bartın, Türkiye

Bartın: Reading the city and catchment together

The Bartın flood of 21 May 1998 is one of the historical events that affected a substantial part of the riverside city. Bartın AFAD notes that work on the Kirazlıköprü Dam began after the flood. A field assessment by the Turkish Medical Association records effects on homes and workplaces as well as transport, electricity and communications. These records allow the urban consequences and catchment-scale prevention work to be considered together. Post-disaster health and infrastructure needs also form part of the historical account; river level alone cannot describe the event.

For a present-day project, the measurements and city conditions of 1998 should be kept distinct from today’s situation. The effect of a later dam or altered channel cannot be quantified merely by noting that it exists. Upstream runoff, tributary connections and urban water passages need examination using current data. Old flood marks and field reports may help challenge a model result, but they cannot replace a modern terrain survey. The historical example is valuable because it makes the connection between a city and its wider catchment visible.

Engineering interpretation

An urban flood assessment may need more than the channel section within the city. Upstream storage, tributaries, bridges and downstream connections should be considered together, with protection options compared through current hydraulic scenarios.

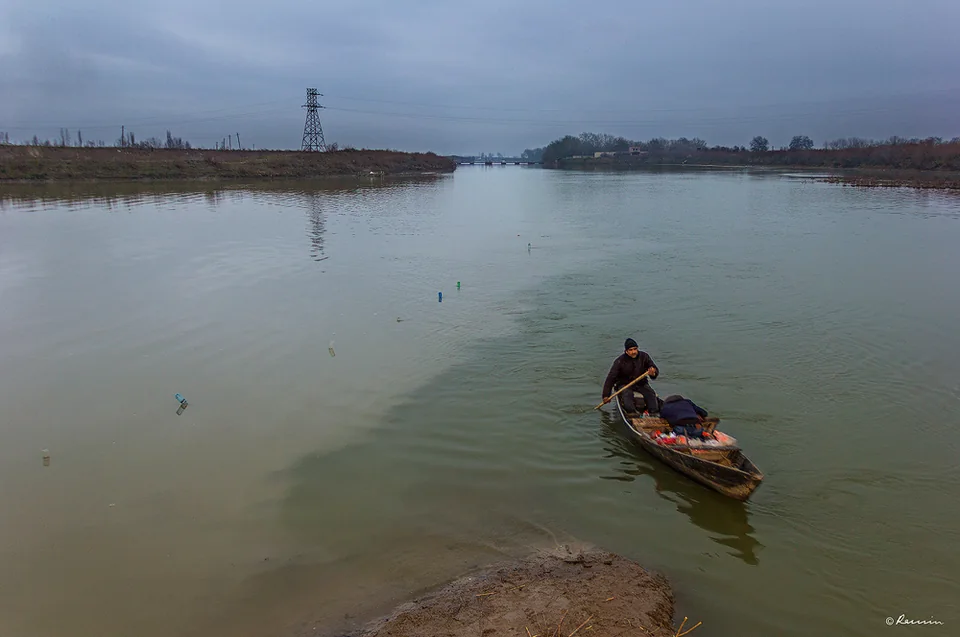
Kura–Aras confluence, Sabirabad — a regional photograph from 2016; it does not show the 2003 flood.
Kura–Aras confluence, Sabirabad — a regional photograph from 2016; it does not show the 2003 flood. Photo / source: Hasanalizade · CC BY-SA 4.0 Resized and converted to WebP; same licence.

Kura–Araz, Azerbaijan

Kura–Araz: River flooding and rising groundwater

Floods around the Kura and Araz rivers in spring 2003 affected settlements and farmland in southeastern Azerbaijan. The IFRC May bulletin records rainfall and snow conditions, April field assessments, and needs around Salyan, Neftchala and Sabirabad. Its October review also describes groundwater emerging in riverside villages and difficulties in obtaining safe drinking water. The event is therefore dated to April–May rather than a single day. A bulletin’s publication date is not treated as the starting date of the entire flood; the precision of the evidence is preserved.

This example reminds readers that water impacts need not be limited to visible river overflow. Drainage, groundwater and drinking-water systems are different parts of an assessment on low ground. When reading a historical aid report, an observed impact should be separated from a proposed response. A condition reported in one village does not establish the same water level or soil conditions along the whole river. The event supports collecting site-specific information and investigating surface-water and groundwater connections, rather than transferring a ready-made design dimension to another location.

Engineering interpretation

A riverside parcel assessment should examine groundwater, drainage outlets and soils as well as surface inundation. Hydraulic protection, water quality and public-health measures are distinct requirements that need coordination between disciplines.

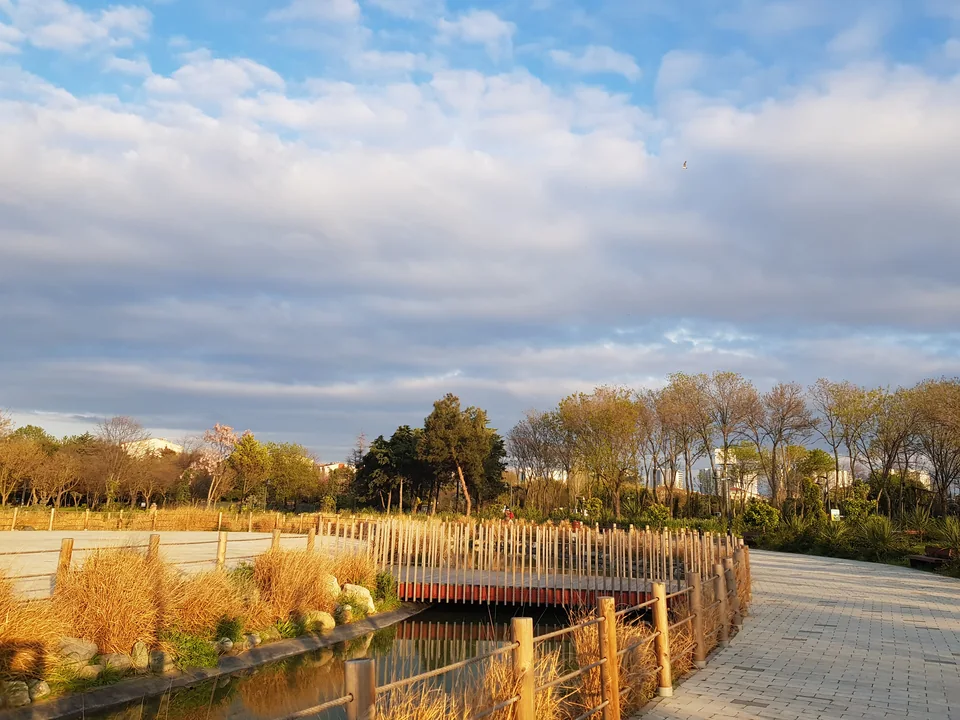
Ayamama Life Valley, Bakırköy — a regional photograph from 2025; it does not show the 2009 flood.
Ayamama Life Valley, Bakırköy — a regional photograph from 2025; it does not show the 2009 flood. Photo / source: Historianengineer · CC0 Resized and converted to WebP.

İstanbul–Tekirdağ, Türkiye

Western Marmara: Intense rainfall over short periods

Rainfall from 7 to 9 September 2009 produced floods around western İstanbul, Tekirdağ and the western Marmara region. The Turkish State Meteorological Service investigates rainfall areas active at different times using radar, satellite and station information. Silivri and Çatalca are included in the event area. The report examines hourly rainfall alongside daily totals, making the duration of rainfall visible as well as its amount. This account summarises the regional meteorological event; it does not provide a forensic conclusion that attributes damage on an individual parcel to one cause.

The example shows the limitations of explaining urban flooding using only the nearest daily rainfall record. A station total may not fully represent intense rain falling over another catchment in a short period. Rainfall duration and spatial information need to be read with land use and flow paths. When reusing historical observations, station location, recording interval and time reference should remain explicit. Recurrence results for different durations must not be mixed. The useful lesson is a careful approach to choosing project rainfall inputs, rather than a ready-made discharge for another site.

Engineering interpretation

Urban drainage needs short-duration intensity and catchment response time alongside daily totals. IDF information, station representativeness, runoff from surfaces and inlet capacity should be examined together for the project.

Kura–Aras region, 14 May 2010 — crop of NASA Terra/MODIS false-color satellite imagery.
Kura–Aras region, 14 May 2010 — crop of NASA Terra/MODIS false-color satellite imagery. Photo / source: NASA GSFC / MODIS Rapid Response Team · NASA public domain / media guidelines Geographic crop, resize and WebP conversion.

Kura, Azerbaijan

Kura: Expanding water in the lower basin

Flooding around the Kura River in 2010 affected extensive areas of Azerbaijan’s lower basin. The IFRC final report dates the onset to 4 May and describes assistance for people evacuated from settlements around Sabirabad. NASA’s satellite observation of 14 May compares accumulated water near the Kura–Araz confluence with an earlier image. A field assistance record and a wide-area observation therefore show different aspects of the same event. Giving the onset date does not imply that flooding ended everywhere on one day or that every location reached the same level.

A satellite image can help interpret the extent of a large river flood, but it does not automatically provide water depth at ground level. Acquisition time, clouds, surface characteristics and the colour combination require appropriate interpretation. Assessing water at settlements also needs ground elevations, river levels and drainage connections. When bringing historical examples into a current project, later changes to embankments and water structures should be investigated. This event encourages reading the lower basin as a connected system, and combining different observations rather than focusing on one channel section.

Engineering interpretation

Lower-basin risk should consider reservoir operation, embankment safety and floodplain flow paths together. Satellite extent complements surveyed elevations and observed levels; it does not determine a building elevation or design discharge by itself.

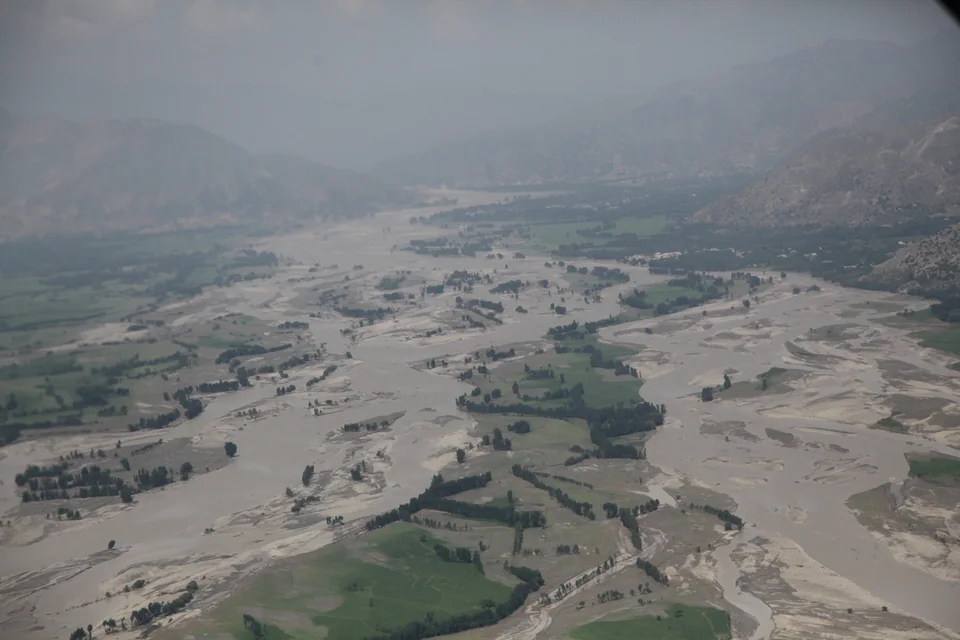
Near Ghazi, Pakistan — an aerial view of flooding from a helicopter on 5 August 2010.
Near Ghazi, Pakistan — an aerial view of flooding from a helicopter on 5 August 2010. Photo / source: Horace Murray, U.S. Army · US federal public domain Resized and converted to WebP.

Indus basin, Pakistan

Pakistan: Flooding progressing along the Indus

Monsoon rainfall in Pakistan during summer 2010 led to extensive flooding along the Indus River and its tributaries. The Pakistan Federal Flood Commission’s annual report documents the event’s development through rainfall and river observations. NASA’s review uses satellite evidence to describe water progressing from the north to lower regions and remaining in some areas for an extended period. The July–August label identifies the intense rainfall period; it does not imply that all consequences ended within those months. Recession and renewed use of flooded land can follow a different timetable from the initial rise.

This large-basin example shows that the place receiving rainfall and the place experiencing a flood impact may differ. Water travels along the river in connection with floodplain routes and existing infrastructure. Falling water in one region does not mean danger has ended elsewhere at the same time. Historical observations should retain their location and date, with flood spreading distinguished from subsequent drainage. The event encourages examining how long water remains and how it leaves an area, alongside the peak discharge that first brings it there.

Engineering interpretation

Large-river projects should examine hydrograph volume, floodplain entry and exit routes, prolonged inundation and transport connections together. Peak water level alone does not describe the duration of disruption or recovery.

Melen River, Melenağzı — a regional photograph from 2015; it does not show the 2019 flood.
Melen River, Melenağzı — a regional photograph from 2015; it does not show the 2019 flood. Photo / source: Acar54 · CC BY-SA 4.0 Resized and converted to WebP; same licence.

Akçakoca–Cumayeri, Türkiye

Düzce: Small catchments and transport connections

Rain beginning on the evening of 17 July and continuing through 18 July 2019 produced floods around Akçakoca and Cumayeri in Düzce. The provincial Disaster Risk Reduction Plan records affected villages and damage to roads, bridges, culverts and drinking-water networks. The event therefore shows connections between villages and essential services as well as impacts on riverside buildings. AFAD housing notices confirm how those disasters fed into recovery work. The flood impact is not reduced to a water level at one settlement; access and basic infrastructure are also read as part of the record.

Records of this kind help investigate the importance of a small water crossing within a wider road network. A bridge or culvert assessment should ask about surrounding flow routes and alternative access as well as cross-sectional area. Recorded damage cannot all be assumed to arise from the same mechanism, however. Scour, blockage, geometry and soil conditions require investigation at the individual structure. The 2019 example supports connecting structure-scale calculations with catchment and transport-network assessment; it does not assign a dimension or a definite cause to another crossing.

Engineering interpretation

Bridges and culverts need separate checks for flow capacity, blockage scenarios and scour. The road network served and alternative access should also inform risk assessment; a damage mechanism must not be determined from a photograph alone.

Aksu Stream, Dereli — a regional photograph from 2015; it does not show the 2020 flood.
Aksu Stream, Dereli — a regional photograph from 2015; it does not show the 2020 flood. Photo / source: Karel61 · CC BY-SA 4.0 Resized and converted to WebP; same licence.

Dereli and surroundings, Türkiye

Giresun: Flooding, landslides and field evidence

Floods, landslides and inundation followed intense rainfall in Giresun on 22 August 2020. The AFAD activity report includes the central district, Espiye, Doğankent, Dereli, Tirebolu, Güce, Görele and Yağlıdere in the event area. Trabzon AFAD’s field account describes support for search, rescue and recovery work. Different processes occurring during the same event require a broader reading of the historical record than a single flooded-street photograph allows. This account describes the verified regional extent of the disaster; it does not propose one mechanism for damage to every road or building.

Mud and material left after flooding are evidence of an event, but do not by themselves establish water depth or peak discharge. Material transported within the channel, movement from hillsides and subsequent cleaning need to be distinguished. Historical photographs become more useful when combined with measured sections and observations made during the event. For a current project, today’s channel and surrounding ground require renewed examination. The Giresun example provides a starting point for considering hydraulic capacity together with landforms, sediment connections and findings from different engineering disciplines.

Engineering interpretation

A fixed-bed water model may not be sufficient in steep catchments. Sediment and debris sources, possible blockage and slope movement need separate investigation, with hydraulic, geotechnical and structural findings connected.

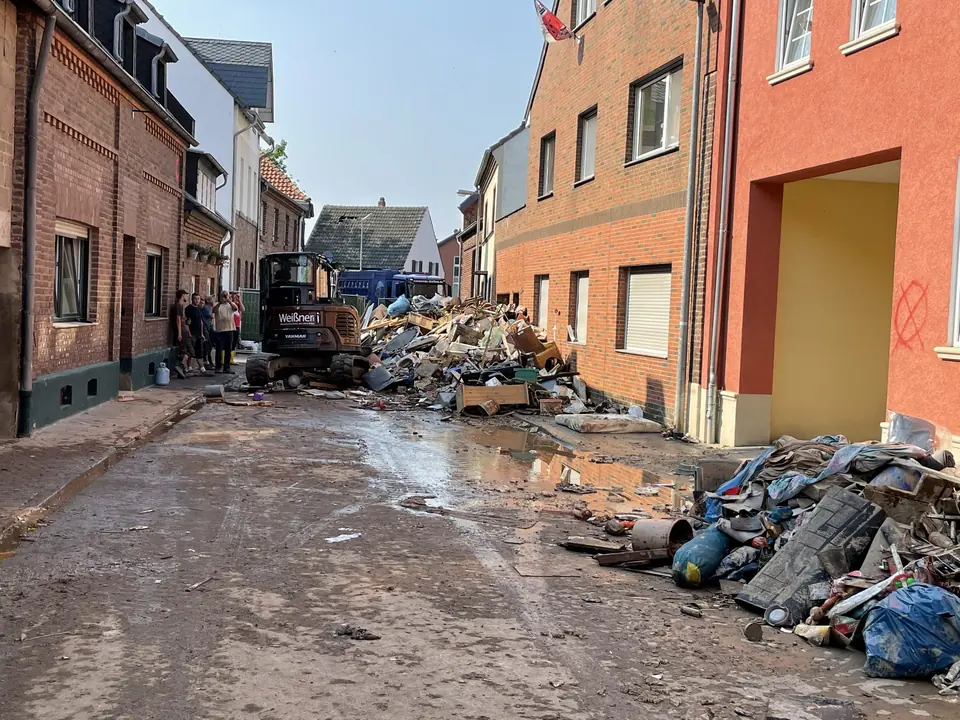
Ahrweiler, Germany — debris and cleanup following the July 2021 flood.
Ahrweiler, Germany — debris and cleanup following the July 2021 flood. Photo / source: Smigel · CC BY-SA 4.0 Resized and converted to WebP; same licence.

Ahr Valley, Germany

Ahr Valley: Rapidly changing river conditions

On 14–15 July 2021, the Ahr Valley became one of the severely affected areas during the intense rainfall and flooding event in western Europe. The German Weather Service, DWD, records prolonged rainfall across numerous river catchments including the Ahr. A peer-reviewed field study examines the transition from rainfall to runoff, flood development along the river and different information sources together. The date here identifies the important rising-water period in the valley; it does not compress the wider European event into a single day. Settlements, transport and river conditions are read as dimensions of the regional event.

The appearance of a river during ordinary observation does not establish how its geometry will behave during an extreme event. Missing or interrupted measurements also do not mean the maximum level is known with certainty. Reconstruction should distinguish the evidence supplied by gauges, field traces and model results. Uncertainty remains visible rather than reducing the event to one estimate. The Ahr example raises technical questions about local structures, the valley’s connected flow routes and the time between a warning and action on the ground.

Engineering interpretation

Rapid flooding requires attention to rate of rise and access time as well as water level. Constrictions, flow around bridges and evacuation routes should be investigated together; missing observations must not be replaced with false certainty.

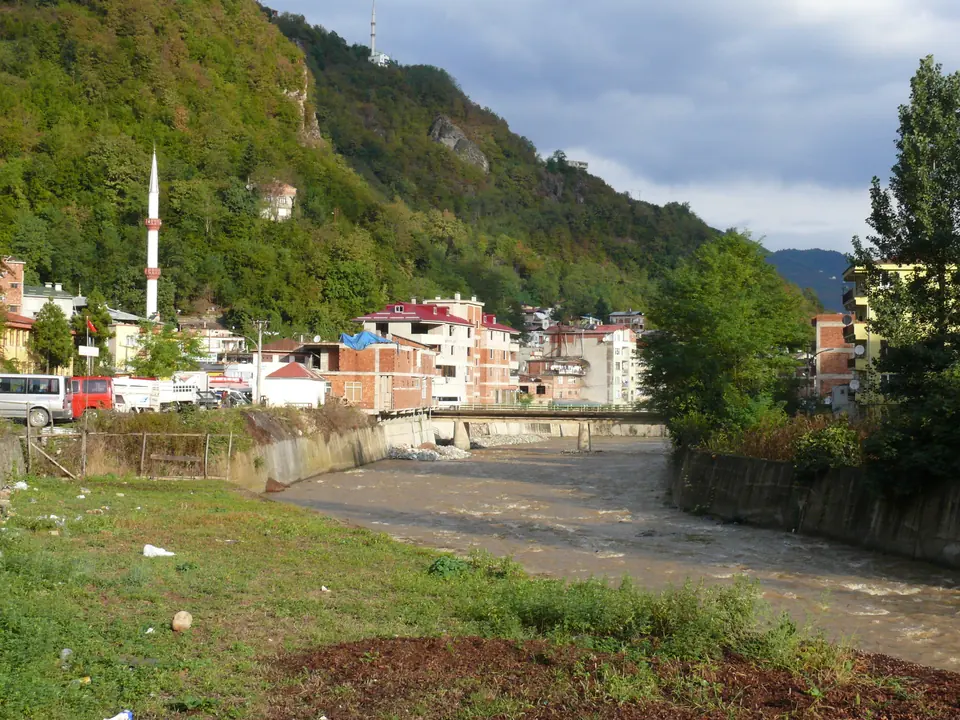
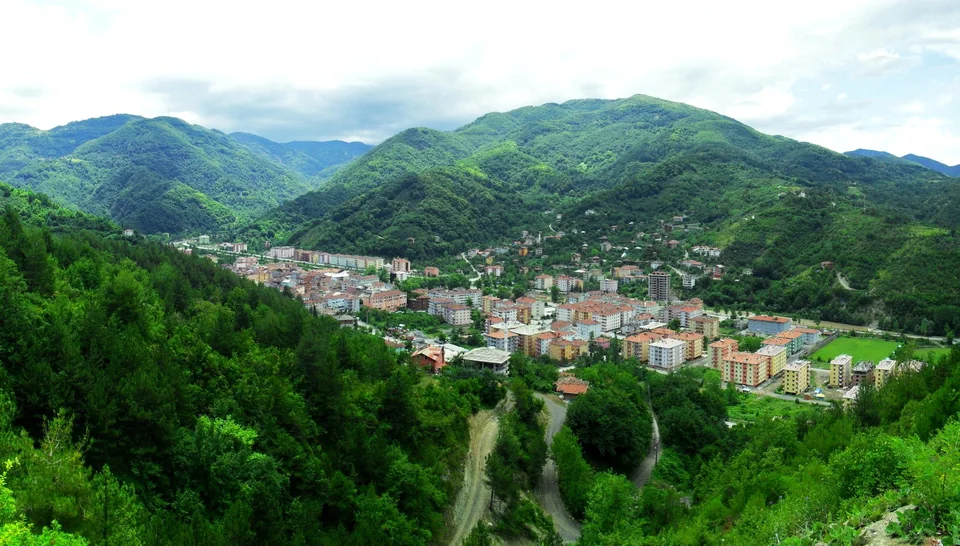
Bozkurt, Kastamonu — a regional photograph from 2010; it does not show the 2021 flood.
Bozkurt, Kastamonu — a regional photograph from 2010; it does not show the 2021 flood. Photo / source: Barış37 · CC BY-SA 3.0 Resized and converted to WebP; same licence.

Kastamonu–Sinop–Bartın, Türkiye

Western Black Sea: Valley, city and infrastructure

Intense rainfall beginning on 11 August 2021 led to flooding and inundation in Kastamonu, Sinop and Bartın. AFAD’s first-anniversary review records severe impacts in Bozkurt and recovery work involving homes, bridges and infrastructure. The Turkish State Meteorological Service’s 2021 disaster report documents regional rainfall and damage to infrastructure including bridges. Because the event developed in different provinces and valleys, a photograph at one location does not represent flow throughout the region. The onset date does not mean every river reached its maximum simultaneously or every settlement experienced the same conditions.

Translating this example into project work begins by separating the regional account from site-specific information. Routes through a town, bridge crossings, building elevations and side streets require investigation with current measurements. A historical damage image can raise a risk question, but cannot determine design discharge, soil resistance or a safe floor elevation by itself. Recovery work also has its own project conditions and checks across disciplines. The western Black Sea event is a reminder to consider catchment-to-settlement flow connections, exposure and access together.

Engineering interpretation

Settlement risk requires depth, velocity, building elevation and safe access to be read together. The HEC-RAS domain should include critical catchment-to-town flow connections, while hydraulic findings remain distinct from structural and geotechnical checks.

Read the past, assess your project’s risk

A historical event cannot replace an assessment based on your project’s data. Share your location, terrain survey and project purpose so we can define the flood-analysis scope together.