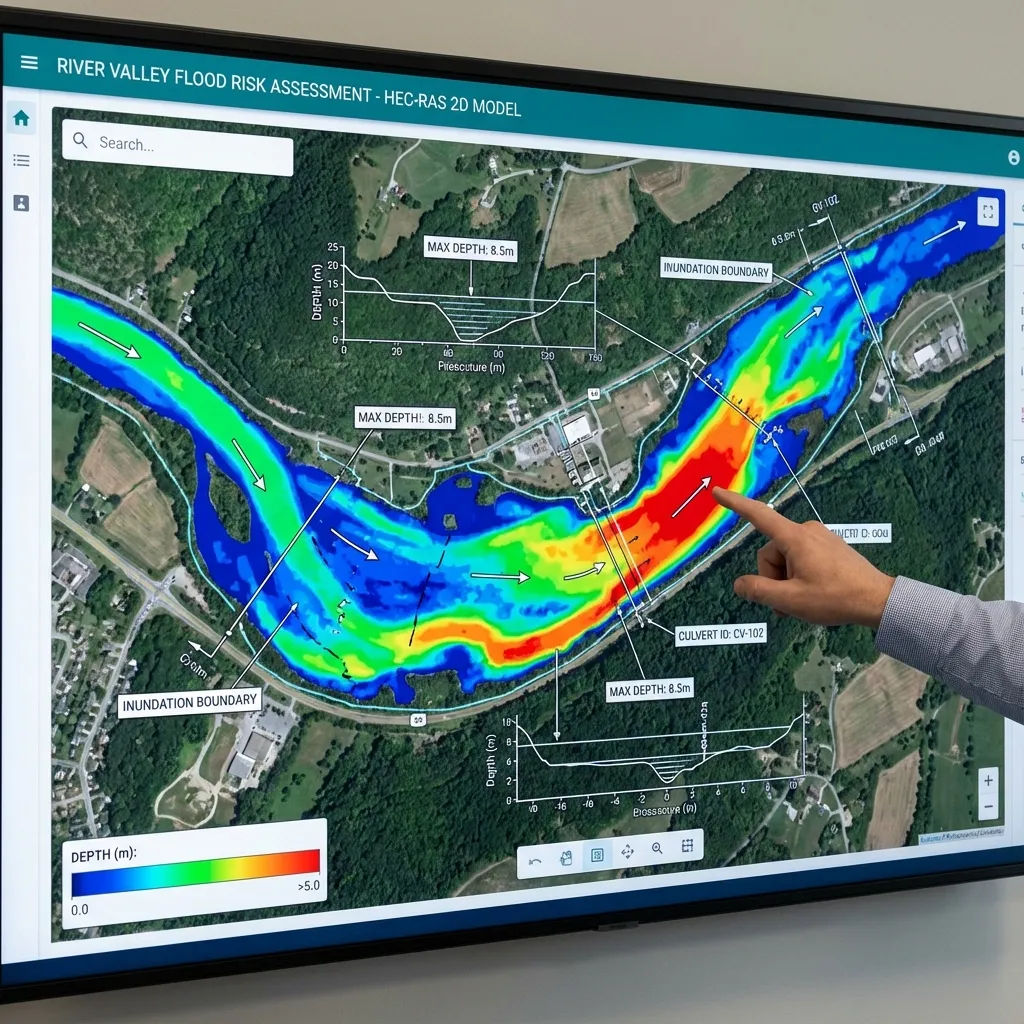
A colour on a flood map is meaningful only with its legend and scenario. Different return periods, structures or downstream levels produce different results at the same site. Owners should consider depth, velocity, access and data quality as well as whether a parcel lies within the coloured area. The map represents calculated conditions, not a guaranteed forecast of every future flood.
What the inundation boundary represents
Extent maps show areas flooded or treated as wet by the model for the selected scenario. Terrain and mapping settings, including minimum displayed depth, influence the boundary. Treating one line as an exact physical limit can mislead, especially for shallow water. Overlay parcels, roads and buildings in the same coordinate system. A boundary ending at the edge of the model does not establish safety outside the study area.
Distinguish depth from water-surface elevation
Depth is water-surface elevation minus local ground elevation. Water-surface elevation is referenced to a defined vertical datum. A depth of two metres cannot be compared directly with a floor elevation. First confirm a common datum. Ground at 100.0 m and water at 101.2 m give 1.2 m depth. A floor at 101.5 m indicates a geometric difference for that scenario; entry points, uncertainty and an appropriate allowance still need assessment.
Assess velocity and hazard together
Shallow, fast flow can create serious hazards, while slow but deep water may compromise access and use. Review both depth and velocity maps. If a hazard classification is used, state its method and thresholds rather than assume one universal colour or speed limit. In 2D results, check how velocity is represented at cells or faces. Near bridges, constrictions and wetting fronts, interpret local values alongside terrain and computational resolution.
The time meaning of maximum maps
Maximum-depth maps may combine the greatest depth at each location over the simulation. Maximum velocities can occur at different times. Multiplying the separate maxima to create a hazard indicator may therefore violate its time-consistency requirements. At critical locations, inspect time series or simultaneous maps. Onset and duration also matter when comparing operating conditions, access and alternative scenarios.
Checks when receiving maps
Check study extent, scenario, units, horizontal and vertical references, scale and legend on every delivered map. Request georeferenced outputs where needed, and confirm current parcel and building-layout versions. An uncoloured area may represent dry land, missing data or values below a display threshold; document which. Enlarged views of critical sections and entry points reveal detail lost in overview maps. Decisions should not rely on screenshot colours alone. Consistent legends aid comparison, but read each map’s calculation conditions separately.
Translating results into project decisions
A project owner should receive more than a coloured map. The report should bring together the data inventory, survey date, horizontal and vertical reference systems, method used to obtain discharges, scenarios examined and limits of the model domain. Legends, scales, scenario names and elevation references make maps easier to compare with architectural or infrastructure drawings. Calculations should explain the reasoning behind a decision and identify the assumptions whose revision would require the results to be reconsidered.
At quotation stage, share the study boundary, structure type, available surveys and expected deliverable files. These details help define the scope and additional data requirements. Discharges, elevations or design approaches taken from another project should not be transferred directly to this site. The competent authority's project-specific requirements are checked separately. A flood assessment does not guarantee that no future event will occur; it provides an engineering basis for understanding risk and comparing mitigation options under the selected data and scenarios.
Sources and related articles
Let's discuss your project's data requirements and reporting scope.
Request a project quote