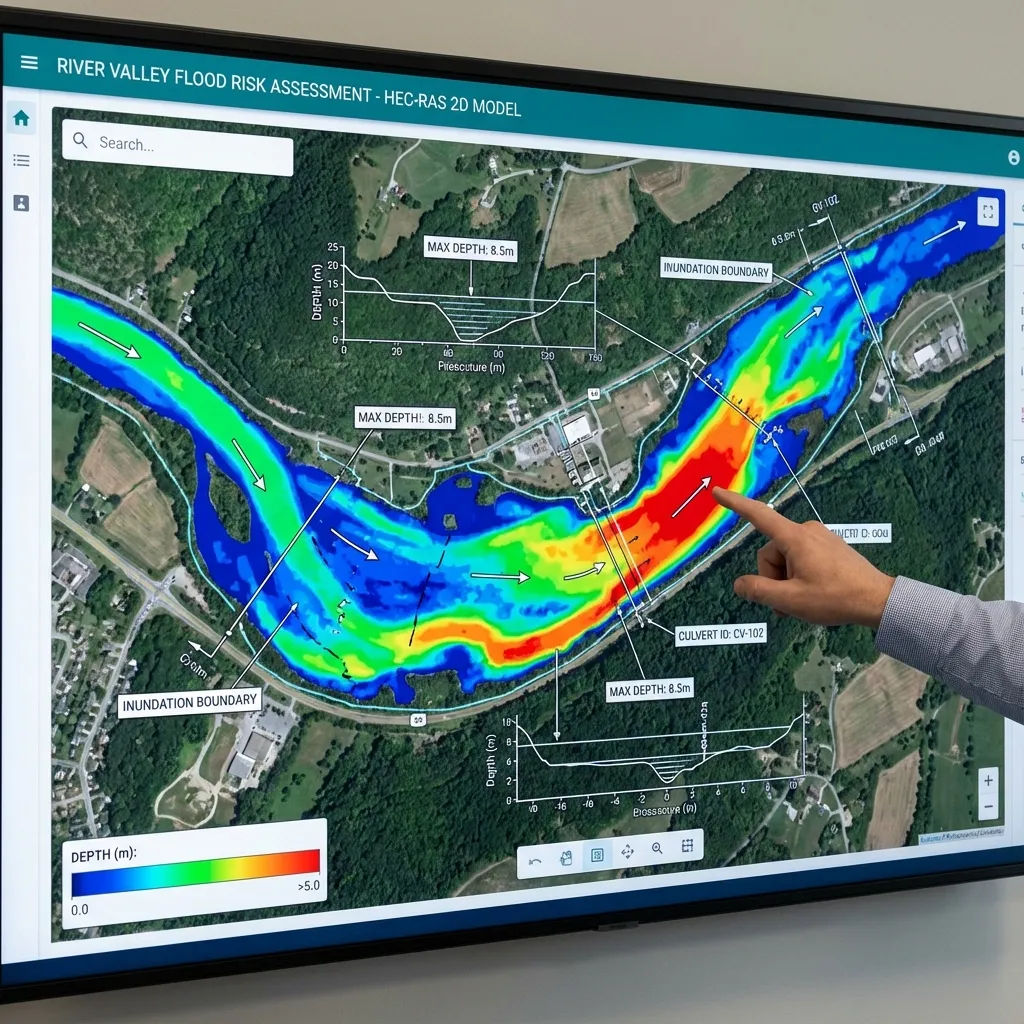
HEC-RAS flood studies may use a one-dimensional (1D), two-dimensional (2D), or coupled approach. “2D flood analysis” describes modelling that calculates flow spreading laterally over terrain as well as along the channel. The choice depends on the catchment, flow conditions, structures, available observations, and the engineering question. A 2D model is not automatically required for every project and does not guarantee a more accurate result by itself. See our flood analysis service for the project scope.
| Criterion | 1D approach | 2D approach |
|---|---|---|
| Flow representation | Uses average flow quantities along a channel network and cross-sections. | Uses a terrain-based computational mesh to represent flow paths in different directions. |
| Geometry and data | Needs cross-sections, channel connections and the geometry of structures affecting flow. | Needs a terrain surface, mesh, elevation transitions and the geometry of structures affecting flow. |
| Typical outputs | Water-surface levels, average velocity at cross-sections and profile results. | Maps of depth, velocity direction and flood extent over terrain. |
| Result checks | Assess cross-section representation, structure calculations, boundary conditions and roughness assumptions against observations. | Assess terrain and mesh representation, time step, mass balance, boundary conditions and roughness assumptions against observations. |
What do 1D and 2D models represent?
A 1D model represents flow along channel reaches and cross-sections. It can be effective when a defined channel dominates the flow path and its cross-sections and structures can be adequately described. A 2D model solves flow over a specified terrain surface within a computational mesh. Depth and velocity direction can be calculated across cells and cell faces, and maps can show different flow paths over the floodplain. A 1D/2D connection may be considered where interaction between a channel and its floodplain matters.
When should 2D flood analysis be considered?
A 2D representation may help where flow paths divide, broad low-gradient floodplains matter, or roads, embankments, intersections and built-up areas influence the result. If the question includes where water travels, how it divides, or how flow direction changes across the site, this method may be suitable for assessment. The choice is based on the study purpose and data, not simply on software names.
What terrain and project data are needed?
The study needs a terrain surface with documented horizontal coordinates and vertical datum. A digital terrain model does not necessarily capture the riverbed, walls, embankments, road fills, culverts or bridges at every scale. Surveys and structure geometry may be needed to represent these features. Record the data date, resolution, gaps and vertical reference. Compare terrain and structures with project drawings. Missing or inconsistent data can affect model boundaries and interpretation, so describe these limits in the report. Use the flood analysis data checklist to prepare available files.
Computational mesh, breaklines and time step
Cell size alone does not determine result resolution or accuracy. The mesh should represent important changes in terrain and flow paths. Breaklines can align the mesh with sharp elevation features such as road crowns, embankments and channels. Their geometry should be supported by surveyed elevations; a line on the mesh does not establish a real barrier. Smaller cells may resolve more detail but increase computational demand and can require an appropriate time step. Select and test the time step in view of velocities, mesh geometry and numerical stability. There is no universal cell size.
Boundary conditions and result checks
The upstream discharge or hydrograph and downstream water level, hydrograph, or other selected boundary should match the scenario. If the model boundary cuts across important flow paths, results may depend on that boundary assumption. Where possible, compare alternative discharge, downstream and Manning roughness scenarios. Review numerical stability, water-balance error, water-surface profiles and physically plausible flow paths. When observations or high-water marks are available, compare them at the correct elevation datum and date. Without calibration data, do not describe the model as validated. See the guides to HEC-RAS boundary conditions and flood-model uncertainty.
Reports, maps and limitations
Depending on the agreed scope, outputs may include water-surface elevation, depth, velocity, flood extent and scenario maps. Plans should identify units, legend, coordinates and vertical datum. The technical report should explain data sources, model extent, boundary conditions, mesh and time-step choices, validation approach and limitations. A map alone does not determine life safety, building damage or a permit decision. These questions also require the relevant project criteria, building data and authority request. The USACE HEC-RAS 2D manual documents the 2D solution, and the HEC-RAS user manual describes the 1D components. Neither replaces project-specific requirements.
Discuss your project data and 2D flood analysis requirements with our team.
Request a flood analysis quote