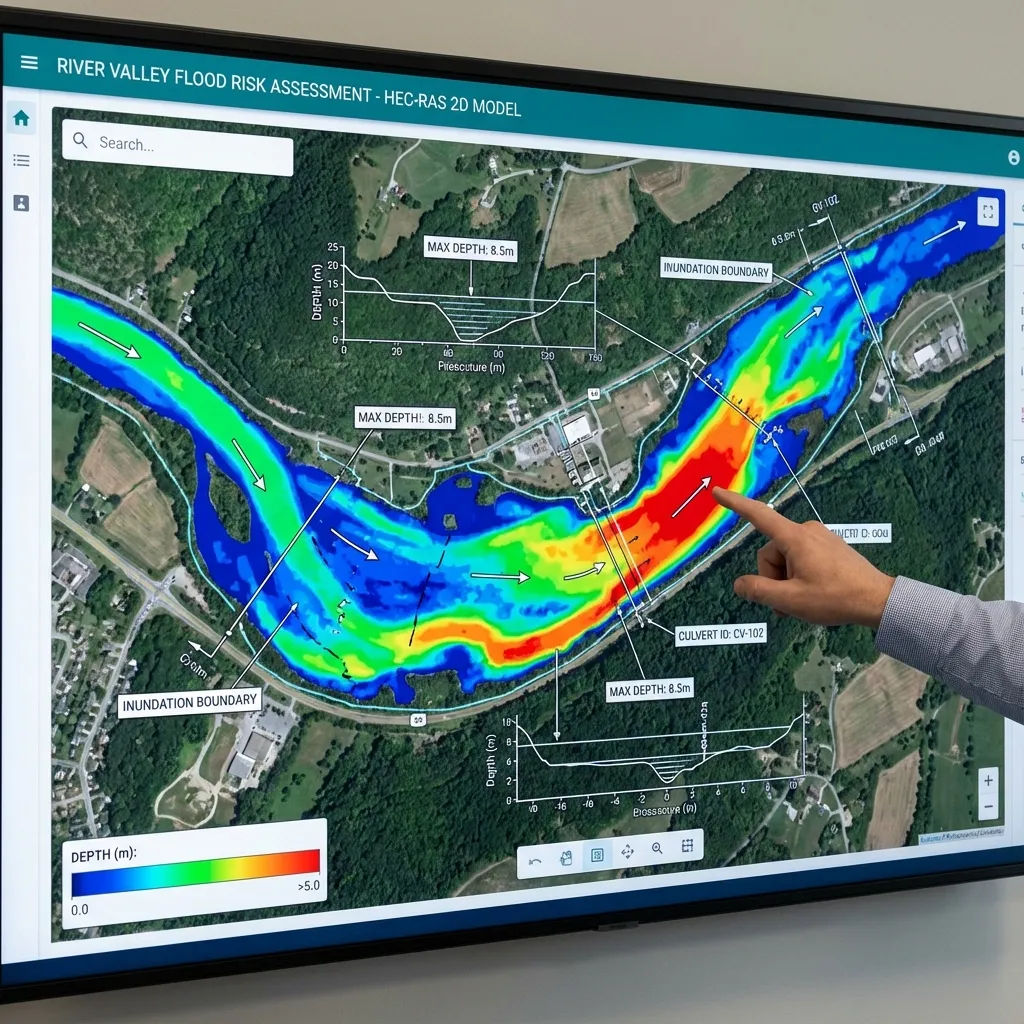
Detailed maps do not make model inputs certain. Measurement errors, hydrological estimates, terrain gaps and simplifications affect results. Uncertainty analysis examines how decisions depend on those variables. Owners need to know both the calculated level and its response to plausible input changes. Define scenarios on a consistent base model and record comparison conditions.
Separate sources of uncertainty
Data uncertainty includes rainfall, flow, terrain and structure measurements; parameter uncertainty includes roughness and runoff assumptions; structural uncertainty involves dimensionality, equations and omitted processes. Combining everything into one safety factor can obscure causes. Inventory sources and reliability, then justify parameter ranges using site evidence or references. Arbitrary broad ranges are not a substitute for systematic sensitivity analysis.
A one-variable sensitivity experiment
Hold the base model fixed and vary one parameter, such as site-supported low, central and high roughness. Compare decision-relevant outputs: parcel levels, bridge head differences or inundated area. Keep geometry and other inputs unchanged. This reveals influential variables but not all interactions. Report physical differences affecting the project as well as percentage changes.
Conditions that change together
Inputs may be dependent: high flow and downstream water level can belong to one event, while some combinations are implausible. Blockage, future land use and alternative designs answer different questions. Record joint changes and their rationale. Automatically combining all adverse extremes may be conservative but poorly justified. Do not assign a return period to a combined scenario without supporting probability analysis.
Interpretation around a decision threshold
Suppose a checkpoint's central level is 101.20 m and scenarios span 101.05–101.45 m, with an entrance at 101.30 m. The entrance is dry centrally but flooded in some runs, prompting better data, checks or redesign. This span is a scenario range, not a statistical confidence interval. Probabilistic intervals require input distributions and dependencies. Keep those interpretations distinct.
Scenario register and delivery table
Give scenarios unique names and record changed inputs, values, rationale and files. Review checkpoint elevations, depths and velocities alongside warnings and volume balance. Do not present unstable-run extremes as physical risk scenarios. Label maps and use the register to identify runs needing updates after surveys or revisions. Uncertainty then becomes a usable decision tool rather than a generic closing warning.
Translating results into project decisions
A project owner should receive more than a coloured map. The report should bring together the data inventory, survey date, horizontal and vertical reference systems, method used to obtain discharges, scenarios examined and limits of the model domain. Legends, scales, scenario names and elevation references make maps easier to compare with architectural or infrastructure drawings. Calculations should explain the reasoning behind a decision and identify the assumptions whose revision would require the results to be reconsidered.
At quotation stage, share the study boundary, structure type, available surveys and expected deliverable files. These details help define the scope and additional data requirements. Discharges, elevations or design approaches taken from another project should not be transferred directly to this site. The competent authority's project-specific requirements are checked separately. A flood assessment does not guarantee that no future event will occur; it provides an engineering basis for understanding risk and comparing mitigation options under the selected data and scenarios.
Sources and related articles
Let's discuss your project's data requirements and reporting scope.
Request a project quote