
A hydrological analysis seeks a numerical answer to the question "how much water comes from the catchment, when, and with what probability?" for a water structure or parcel. The result is usually a set of design discharges for chosen return periods, which then feed hydraulic calculations, channel and structure sizing or flood models. This article summarises the general steps and what to watch in each; the choice of method depends on the data, catchment characteristics and the competent authority's requests.
1. Define the question and the design criterion
First write down what the analysis serves: a small drainage structure, a river rehabilitation or a flood analysis? That determines which return periods (for example 10, 50, 100, 500 years) and which output (peak discharge, volume, hydrograph) are needed. For what a return period means, see flood return periods.
2. Define the catchment
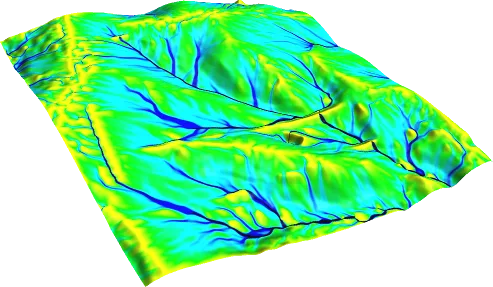
The catchment boundary is derived from a digital elevation model for the chosen outlet and checked against maps. Area, main flow-path length, average slope, land use and soil information are compiled at this stage. A boundary error changes the area and therefore the discharge directly; see catchment boundary and terrain model.
3. Prepare the rainfall data
For the chosen return period, intensity-duration-frequency (IDF) data or a design storm is determined. The station's elevation, record length and how well it represents the catchment are assessed, and the assumption that rainfall is uniform over the catchment is tested. See IDF curves.
4. Choose the time of concentration and loss parameters
The time of concentration is the time water needs to travel from the most remote point of the catchment to the outlet; the Rational Method uses it as the rainfall duration. Loss parameters (runoff coefficient C or curve number CN) are chosen from land use and soil. For a quick check use our time of concentration and SCS-CN calculators; details are in determining a catchment's time of concentration.
5. Select the method: rainfall-runoff or frequency analysis
For small catchments where only the peak discharge is needed, the Rational Method can be used. When runoff volume or a hydrograph is needed, loss methods such as SCS-CN are used with a transformation model (for example a unit hydrograph). Whether the method's assumptions fit the catchment is justified in the report.
If the catchment has a long and reliable flow record, return-period discharges are found by fitting a probability distribution to the annual maxima. Record length, homogeneity and trends over time are checked, and several distributions are compared with goodness-of-fit criteria. Without observations, rainfall-based results can be tested against similar catchments.
6. Check the result and show the uncertainty
Units, area and specific discharge (m³/s/km²) are compared with neighbouring or similar catchments, and differences between methods are investigated. Sensitivity tests show how much the result depends on inputs such as CN, C or duration. For the report structure see the hydrological study report.
A practical checklist for the checking stage: Was the catchment area checked against two different sources (for example a map and a digital elevation model)? Are the station, period and unit of the rainfall data recorded? Was the time of concentration compared across more than one method and the reason for any difference explained? Were the C or CN values based on land use and soil groups? Are the return-period discharges in the expected order, that is, is Q50 smaller than Q100? Is the specific discharge consistent with similar catchments?
Common mistakes include confusing hectares with km², entering rainfall depth in place of intensity, applying the same time-of-concentration formula to every catchment without testing its suitability, and reporting the result of a single method without any other check. When different methods diverge strongly, the difference often shows that an assumption about one of the inputs should be questioned.
For sensitivity, it is often enough to vary C or CN within a reasonable range and show how much the discharge changes; this reveals which input governs the result and which points need measurement or further study. The report should be clear enough for someone else to follow what was calculated with which data: the calculation sheet should show inputs, unit conversions and results together.
A hydrological analysis is the input of the next step. If the output (discharges, hydrograph, volume) will be passed to a hydraulic model, the return period, the unit and the form of the hydrograph must be stated clearly. Hydrological results alone do not give the water level; going from discharge to water-surface elevation needs a separate hydraulic calculation, and the results are reported together.
Even where the catchment has no gauging station, observations in neighbouring catchments are a valuable reference for comparison. Such a comparison shows whether the computed discharge lies in a reasonable range, but the result cannot be transferred directly unless the two catchments are sufficiently similar in area, slope and land cover. The reasoning for the similarity should be written in the report, and if no such comparison can be made, that should be stated as uncertainty.
Sources and related articles
Let's define your project's data needs and the scope of the hydrological study together.
Request a project quote